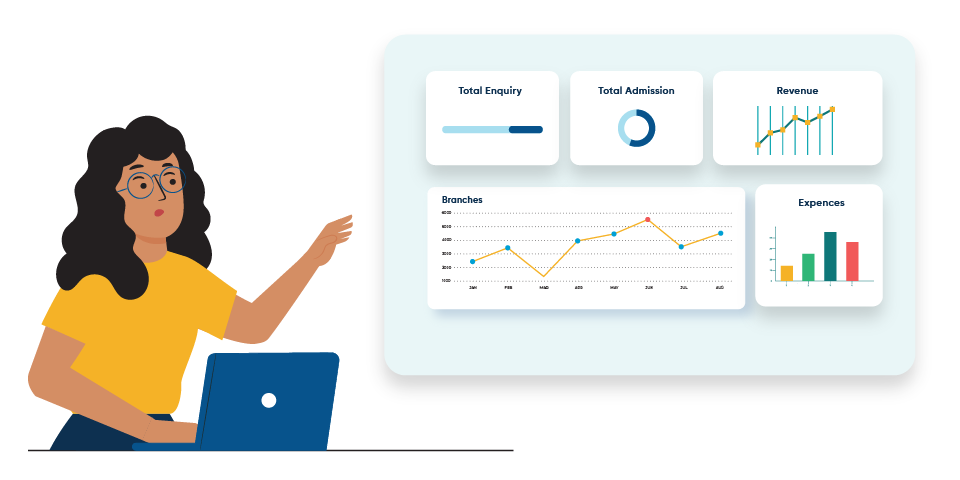
Customisable Dashboards & Reports
Clear insights into your Paying Guest (PG) operations are crucial for success. Our Customisable Dashboards and Reports feature allows PG owners to tailor their data visualisation and reporting needs. This tool lets you easily track vital metrics, monitor performance, and make informed decisions.
Challenges Faced by PG Owners Without Customisable Dashboards
Managing PG operations without a tailored dashboard can lead to various challenges:
Limited Visibility
- Fragmented Data: Important information may be scattered across different platforms, making it hard to get a comprehensive view.
- Manual Reporting: Creating reports manually can be time-consuming and often leads to errors.
Inefficient Decision-Making
- Lack of Insights: Informed decisions can be challenging without clear data visibility.
- Delayed Response: The inability to quickly access critical metrics may lead to delayed responses to operational issues.
Difficulty in Tracking Performance
- Unclear KPIs: Defining key performance indicators (KPIs) becomes complicated without customisable options.
- Limited Flexibility: Fixed reporting formats may not cater to the specific needs of PG owners.
Key Features
Personalised Dashboards
- Drag-and-Drop Interface: Easily customise your dashboard layout with a user-friendly drag-and-drop feature.
- Widgets and Modules: Choose from various widgets to display metrics that matter most to you.
In-Depth Reporting
- Automated Reports: Generate reports automatically at scheduled intervals to save time.
- Custom Report Templates: Create tailored reports to focus on specific aspects of your operations.
Real-Time Data Access
- Instant Updates: Access real-time data to stay informed about your PG operations.
- Interactive Visualisations: Use graphs, charts, and tables for better data interpretation.
Additional Features
- User-Friendly Interface: Navigate easily with an intuitive design.
- Custom Alerts: Set up notifications for important metrics.
Benefits
Enhanced Data Visibility
- Comprehensive Overview: Gain a complete view of your PG operations with customisable dashboards.
- Clear Insights: Easily track and visualise critical metrics for informed decision-making.
- Data Trends: Identify trends over time to make proactive decisions.
- Custom Views: Create tailored views that focus on the metrics that matter most to you.
- Visual Representation: Use graphs and charts for better data interpretation.
- Accessible Data: Access your data anytime, anywhere for maximum convenience.
Improved Operational Efficiency
- Time Savings: Automating report generation lets you focus on other critical tasks.
- Flexibility: Tailor dashboards and reports to meet your specific needs and preferences.
Better Performance Tracking
- KPI Monitoring: Effectively track performance indicators to identify areas for improvement.
- Quick Adjustments: Make timely adjustments to your operations based on real-time data insights.
Data-Driven Decisions
- Informed Choices: Leverage data to make strategic decisions.
- Predictive Analysis: Use historical data to forecast future trends.
User Interface
Our Customisable Dashboards and Reports feature is designed with a user-friendly interface:
Intuitive Layout
Navigate easily through your customisable dashboard.
Data Filtering
Filter data to view specific metrics and timeframes quickly.
Save and Share
Save custom dashboard configurations and share reports with your team.
Customisation Options
Personalise your dashboard to fit your unique needs and preferences.
Conclusion
GullyPG’s Customisable Dashboards and Reports feature equips PG owners with the insights they need to optimise their operations. With real-time data, personalised dashboards, and automated reporting, you can enhance your decision-making process and drive success in your PG facility.